


Hi everyone,
In this post, I will show you how to use the Protein Conformational Transition Search app for finding possible paths between two conformations of a protein. Let us start with a list of requirements, and then a tutorial on how to use the app.
Requirements
- SAMSON 0.7.0
- Protein Conformational Transition Search app
- GROMACS force field interaction model
- FIRE state updater
Before starting the tutorial, I would like to ask you to download this file (ProteinPathSearch) which contains necessary files for this tutorial. After extracting it, you will have a structural model (4akeA_1akeA_minimized.sam) and the topology files for energy evaluation (4akeA.itp, 4akeA.top).
Tutorial
In this tutorial, we will apply the ART-RRT method for finding protein conformational transition paths from a protein. The ART-RRT method is a combination of T-RRT method and ARAP methods. The T-RRT method is used for finding possible pathways and the ARAP methods is for probing possible protein motions. Moreover, a constrained minimization is used for minimizing new motions of the proteins. Let us begin.
Loading the input model
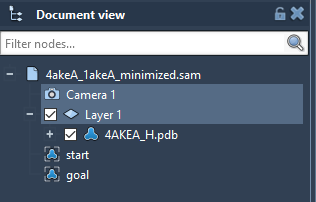
Run SAMSON 0.7.0. Load 4akeA_1akeA_minimized.sam. It will open a structural model of Adenylate Kinase. In the Document View (if you cannot find it, try activating it under Window in the toolbar), you can see the protein under the name 4AKEA_H.pdb and two conformations (start and goal). Our job is to run the app to find a path between the conformations start and goal.
Creating Secondary Structure
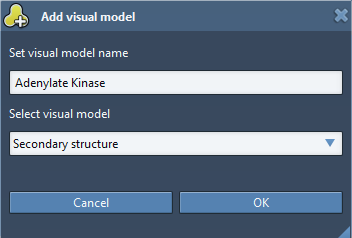
We will now create a secondary structure for the protein by right-clicking on 4AKEA_H.pdb in the Document View, choose Add> Visual Model. In the Add visual model window, set the parameters as shown in the following figure.
Next, we hide the ball-and-stick representation of the protein by unchecking the box next to the 4AKEA_H.pdb inside the Document View for more visibility.
Executing Protein Conformational Transition Search app
Now open the Protein Conformational Transition Search app by clicking on its icon ![]() or you can find its name under App in the toolbar. In the app’s window, you will see two tabs where tab Settings is for setting up the parameters and tab Results is for collecting the results.
or you can find its name under App in the toolbar. In the app’s window, you will see two tabs where tab Settings is for setting up the parameters and tab Results is for collecting the results.
Setting up interaction and state updater models for energy evaluation
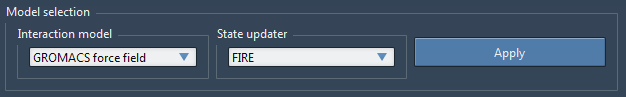
Let us stay inside the tab Settings. Under Model Selection, select GROMACS force field in the Interaction model drop-down list, and FIRE in the State updater drop-down list, then click Apply (see the figure below). This will apply the interaction model and state updater on all the atoms currently in SAMSON.
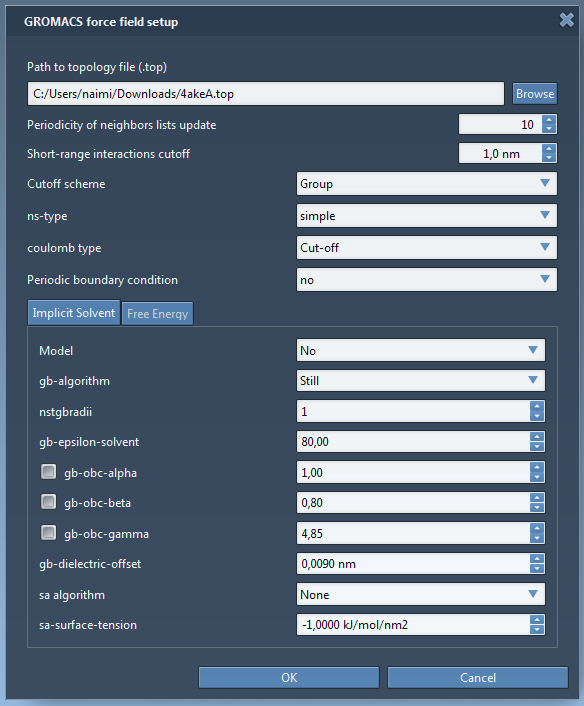
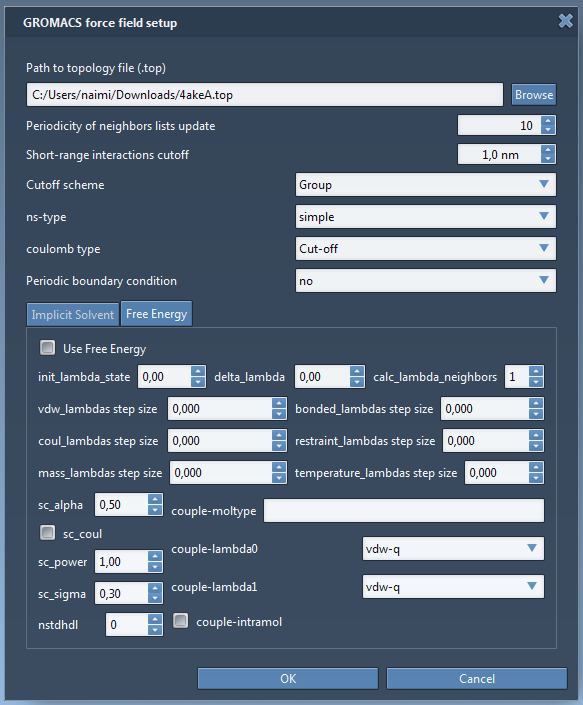
A window pops up asking if you want to continue, click Yes. The GROMACS force field setup will then ask for the topology file for the protein model. Click Browse, then choose to open the file 4akeA.top in the same folder. Keep the rest of the information in the window intact (see the figure below) then click OK.
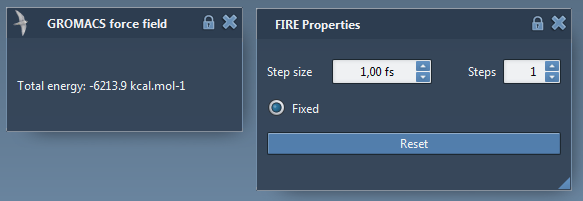
You will see GROMACS force field window popping up for showing the potential energy of the current state of the system, and FIRE Properties window for showing the parameters from the state updater. Set the parameters for FIRE as below
Defining the protein state
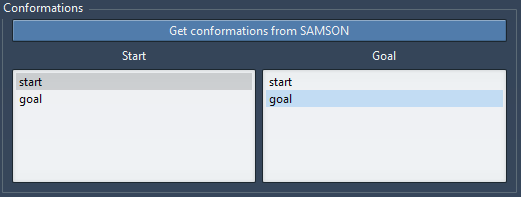
Under Conformations, click Get conformations to obtain all the current conformations in the Document View. Then, select start in the Start list and goal in the Goal list as shown below. It will consider start and goal as the initial conformations for growing the start tree and goal tree, respectively.
Assigning the atom types and defining the sampling box
Now check the box DoF editor to start assigning atom types.
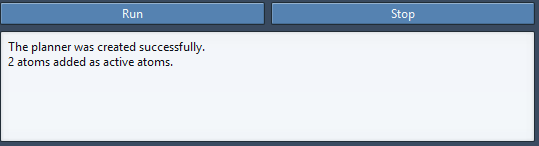
In the Document view, browse to CA in the backbones of residues GLY 12 and ARG 123, select these two alpha carbon atoms (Ctrl + left-clicking for multiple selection). For the sake of simplicity, the Document has a group named CA GLY_12 and ARG_123 which combines links to these two atoms, and you can select these atoms by double-clicking this group in the Document view. Click Add active ARAP atoms button to tell the app that the selected atoms are active ARAP atoms. The rest of the atoms will be implicitly considered as passive ARAP atoms. A new line appears in the text box at the bottom of the app saying that “2 atoms added as active atoms.” as shown in the figure below. This text box is for additional information.
If you are not satisfied with the atom type assignment, click the Clear active ARAP atoms button the start over.
During the atom type assignment, you can notice that another visual model is created for showing the atom type (green for active ARAP atoms).
We will now design the sampling box for active ARAP atoms by checking the box Show sampling box for active ARAP atoms. Set the box dimension as such:
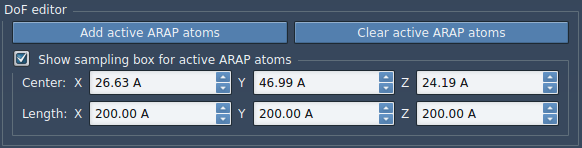
A green box will show up in SAMSON for visualizing this box. This box defines the sampling regions for the chosen active ARAP atoms. This is a cube of 200 angstrom on each dimension.
Defining the parameters
Under Parameters, set them as in the following figure:
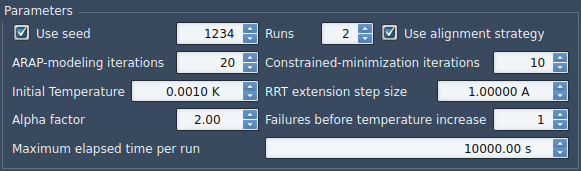
- Use seed box is checked and value is 1234: we use a seed of 1234 for the planner and after each run the seed value is incremented by 1. If the box is unchecked, a random seed is used.
- Runs = 2, we run the method 2 times to extract a maximum of 2 paths.
- Use alignment strategy: if this box is checked, each accepted state of the protein during the search will be aligned with the start conformation. This strategy tends to make the search find a path faster, but it gives artifact sometimes although very rare.
- ARAP-modeling iterations = 20: the number of iterations for solving ARAP modeling.
- Constrained-minimization iterations = 10: apply 10 steps of constrained minimization with FIRE each time a new state is sampled to minimize it.
- Initial Temperature = 0.001 K, Alpha factor = 2, No. of failures before temperature increase = 1 : parameters for T-RRT.
- RRT extension step size = 1 A: the planner extension step size (or edge length in the RRT tree) is 1 angstrom. Note that this is only the prescribed edge length. The final edge lengths can deviate a bit from this value.
- Maximum elapsed time per run: each run is stopped as soon as the elapsed time reaches this value.
Running, Pausing, or Stopping the planner
Click the Run button to start the planner. The searching process can be paused by clicking the Pause button and resumed by clicking the Resume button (both buttons are located at the same place as the Run button while the planner is running). To stop the process, click the Stop button.
During the execution, you can observe the time elapsed for the current run (Current running time), the time elapsed for all of the runs (Total running time), the number of nodes of the tree in the current run (Nodes), the run number (Run), the number of paths found (Paths found), under the Planning information as shown in the figure below.

Obtaining the results
As soon as a path is found, it is added to a list in the Results tab. For example, the following figure shows two paths found.
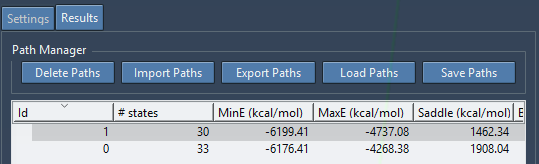
Each path contains the following field
- id: path id.
- # states: Number of conformations (or states) in the path.
- MinE (kcal/mol): Minimum energy of the path conformations.
- MaxE (kcal/mol): Maximum energy of the path conformations.
- Saddle (kcal/mol): Difference between MaxE and MinE.
- Barrier (kcal/mol): Difference between MaxE and First.
- Time (s): Time elapsed for searching this path.
- First (kcal/mol): Energy of the first state in the path.
- Last (kcal/mol): Energy of the last state in the path.
- Remarks: Comments on the path (editable).
- Color: Color of the energy curve for this path.
Viewing conformation energies along the path
To view the energy curve of the path, select a path by clicking on it in the path list. To plot several energy curves, select several paths (by Ctrl+left-clicking for multi-selection).
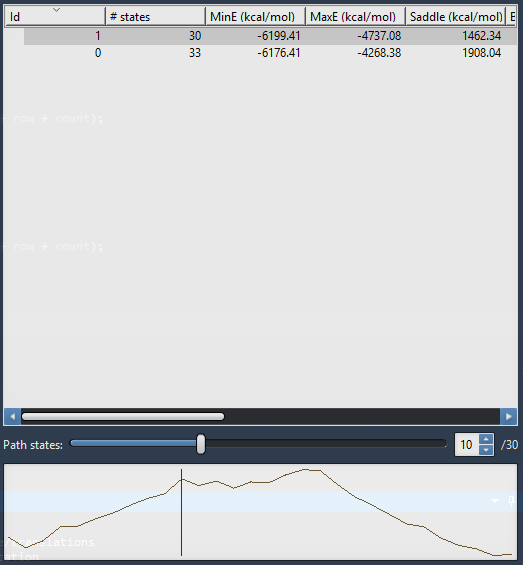
After selecting a path, you can move the slider to select a particular conformation in the path as shown in the above figure. The corresponding conformation is reflected in the structural model in SAMSON and its corresponding energy is shown in the GROMACS force field window.
Exporting path energies or the path list content
Path energy values and the path list content can also be copied to the clipboard by first selecting the interesting paths in the list, then right-clicking as shown in the below figure.
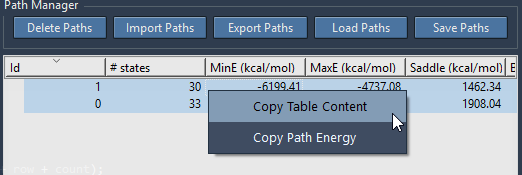
The Path Manager offers other functionalities on paths:
- Delete Paths: delete selected paths from the list.
- Export Paths: create SAMSON conformations for the selected paths in the list.
- Import Paths: select a list of SAMSON conformations and then click this button to import them as a path in the list. Note that to be able to do this, you must apply model selection under tab Settings first.
- Save Paths: save all the selected path in the list in a cpath file.
- Load Paths: load paths from a cpath file. Note that to be able to do this, you must apply a model selection under tab Settings first.
If you have any questions or feedback, please use the SAMSON forum.