

SAMSON has an internal renderer that relies on OpenGL to display visual representations of the data graph. Developers of SAMSON Elements who want to display geometry in a SAMSON viewport typically implement display functions in their classes (e.g. in a class derived from SBMVisualModel to implement a visual model), potentially thanks to display utility functions provided by SAMSON.
The internal renderer is also used to perform node selection, so that developers who want to add selectable objects to the data graph have to implement the displayForSelection function of their data graph nodes.
See User guide: Visualizing for more information on SAMSON's rendering possibilities and settings.
The rendering pipeline
SAMSON renders each frame using the following pipeline:
- Shadow computations: SAMSON renders the data graph and the active editor to compute shadows.
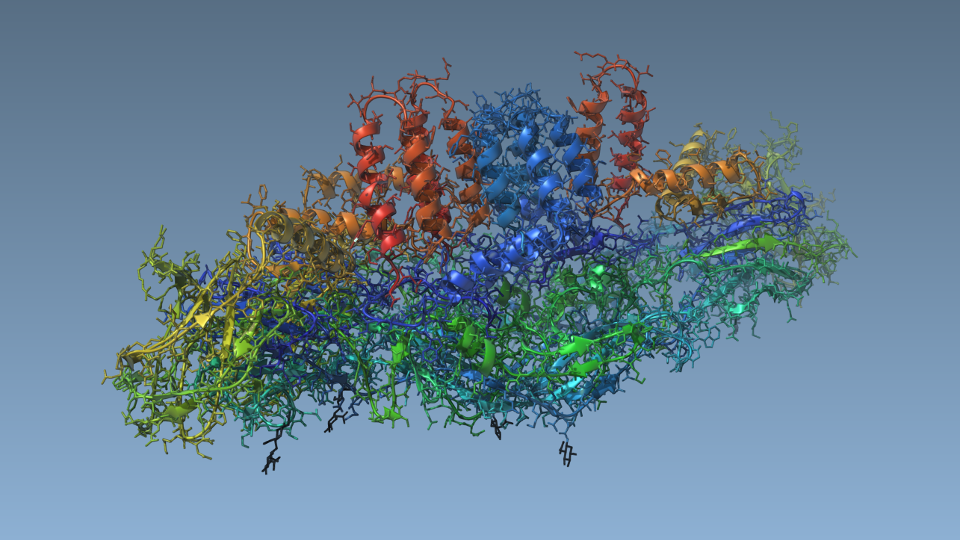
- Data graph rendering: SAMSON renders the data graph. Only structural models have a default visual representation. For other data graph nodes (e.g. visual models, interaction models, etc.), the renderer simply calls the nodes'
displayfunctions, which may be reimplemented in SAMSON Elements. - Editor rendering: the active editor may need to display temporary information in a SAMSON viewport in order to help the user edit the data graph. For example, a nanotube generator might want to display a transparent nanotube to help the user create it while he or she moves the mouse. The SAMSON renderer calls the active editor's
displayfunction at this stage to achieve this type of functionality. - Frame post-processing: this step post-processes the frame to achieve some effects (e.g. shadows, fog, node highlighting, etc.)
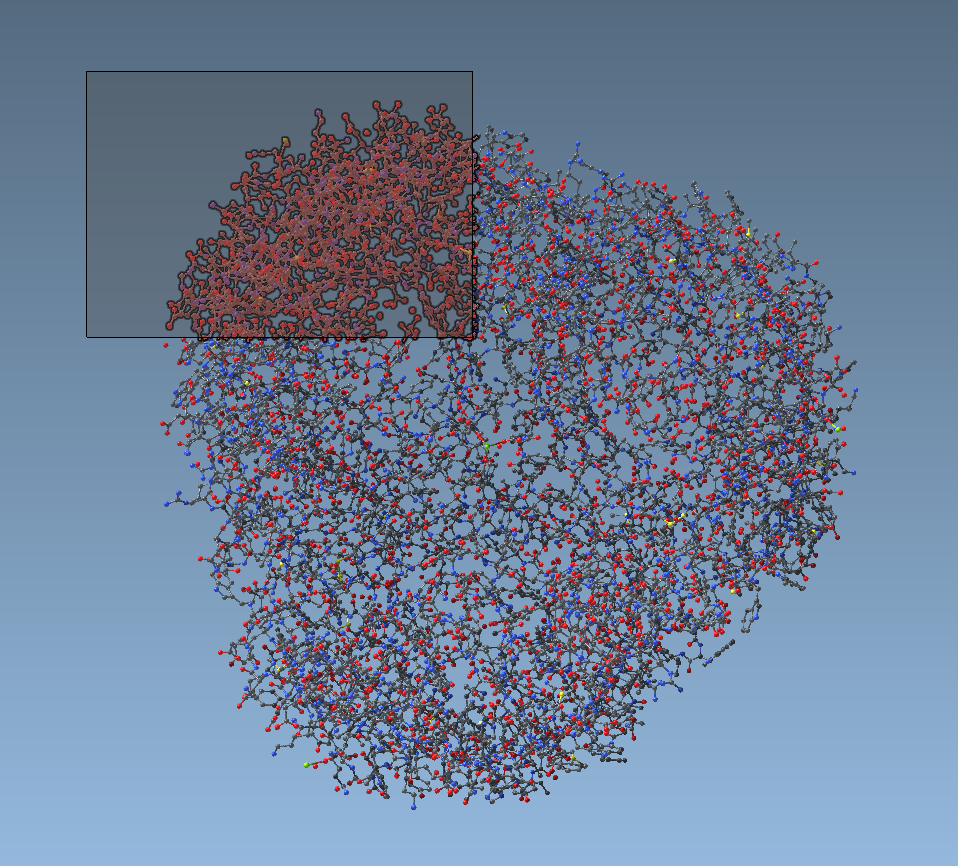
- Editor interface rendering: besides displaying 3D objects in a viewport, the active editor may also need to display a 2D interface in order to help the user achieve his or her task. For example, the rectangle selection editor (Figure below) draws a 2D rectangle while the user is selecting nodes in the viewport. The SAMSON renderer calls the editor's
displayInterfacefunction at this stage to achieve this type of functionality.
Shadows
SAMSON uses shadow maps to implement shadows. During the Shadow computations step, the data graph is rendered from the point of view of the first light, to generate a depth map that is used during the post-processing step to determine whether a pixel should be shadowed or not.
Display utility functions
To perform rendering, SAMSON uses, and requires from developers of SAMSON Elements to use, core-profile OpenGL functionality. For example, shaders are used to display e.g. atoms, bonds, etc. This implies that legacy OpenGL function calls (e.g. glBegin, glEnd, etc.) are not supported and should not be used in SAMSON Elements.
Because using core OpenGL functionality is sometimes cumbersome, especially when rendering simple objects, SAMSON provides several utility functions to render geometric primitives in batches, especially when implementing display functions of data graph nodes. For example, the displayTriangles function makes it easy to display triangles in a SAMSON viewport.
These utility functions, in particular, facilitate the use of the renderer to perform node selection.
Please refer to the documentation of the SAMSON interface for information about each display function.