Visualize center-of-mass motion with Pathlines#
Use the Pathlines visual model to display the center-of-mass (COM) trajectory of selected atoms along a path. This is ideal for visualizing ligand unbinding, macromolecular conformational changes, or tracking atomic motion across simulations.
Why Use Pathlines?#
- Track motion of ligands, residues, or atom groups over a path.
- Visualize center-of-mass displacement in complex systems.
- Analyze unbinding, diffusion, or domain movement.
What you will learn#
In this tutorial, you will learn how to visualize the center-of-mass motion of selected atoms along a path in SAMSON with the Pathlines visual model.
Before you start#
- Log into SAMSON Connect.
- Visit the Pathlines Extension page and click Add.
- Restart SAMSON - your extension will be ready to use.
- If you want to reproduce the example exactly, also keep the related Ligand Path Finder tutorial available for context.
Step 1 - Load the Sample System#
Load the sample system:
- Click Home > Download.
- Paste https://www.samson-connect.net/documents/046f1acd-c799-40f6-8185-cb4847eff795 ().
- Click Download.

This will load a document with this tutorial's sample from SAMSON Connect.
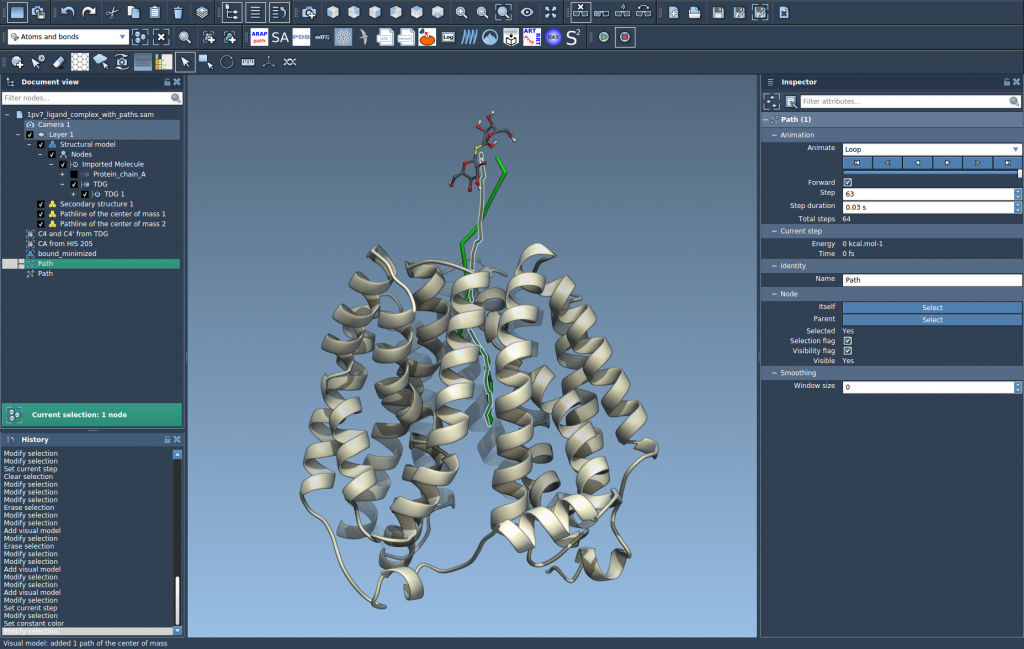
The sample document contains a structural model of Lactose permease (1PV7) with its ligand Thiodigalactosid (TDG) and the unbinding paths generated with Ligand Path Finder (see the Ligand Path Finder tutorial). In the Document view (1), you can see the protein under the name Protein_chain_A, the ligand under the name TDG, and two paths.
- Interface menu > Document view or
, : Ctrl+1,
: Cmd+1
Step 2 - Select Atoms and Paths#
To create pathlines, select in the Document view a group of atoms for which you want to visualize the motion of their center of mass and one or more paths (to select more than one node, hold the Ctrl / Cmd key).
If no atoms are selected, the entire system is used. If no paths are selected, all paths in the document are used.

Step 3 - Create a Pathline Visual Model#
To create a visual model:
- Go to Visualization > Visual model > More... (shortcut: Ctrl/Cmd + Shift+V).
- In the dialog, choose Pathline of the center of mass and click OK.

This creates a visual pathline showing the COM motion of the selected atoms along the selected path(s).

Step 4 - Explore and Customize#
- Double-click a path in the Document view to start/stop it.
- Right-click a path to access Path > ... options in its context menu.
- To access the path controllers, select the path and open the Inspector (Ctrl/Cmd + 2).
- Adjust the visual model properties (color, thickness) in the Inspector by selecting the pathline visual model.

Note
If you delete a path, the associated pathline will also be removed. Deleting atoms used for a pathline will modify the visualization.
Use Cases#
- Display ligand unbinding/rebinding routes.
- Analyze collective domain motions in protein complexes.
- Visualize center-of-mass movement in reaction coordinate workflows.
Next Steps#
Now that you know how to visualize paths, you might want to use the P-NEB app to optimize them - see the tutorial on how to optimize transition paths with the Parallel Nudged Elastic Band (P-NEB) method.
Related tutorials#
- Ligand Path Finder for computing ligand unbinding paths.
- Protein Path Finder for computing protein transition paths.
- Export atom trajectories along paths for exporting path data.
Need Help?#
Have questions or feedback? Feel free to reach out via the Forum, via e-mail, via the Feedback button in SAMSON, or by directly discussing with us.